Analyze Sales Orders
Follow these quick steps to analyze sales performance using the four dedicated reporting views in CURQ 18.
1. Access the Four Reporting Views
In the top navigation bar, click Reporting to access the four dedicated analysis menus:

Sales: Overall sales revenue across all orders.
Salespersons: Performance breakdown pre-grouped by salesperson.
Products: Sales volume and revenue pre-grouped by product.
Customers: Purchase volume and revenue pre-grouped by customer account.
2. Track Overall Sales Trends (Reporting > Sales)
To monitor overall revenue and volume trends across the business:
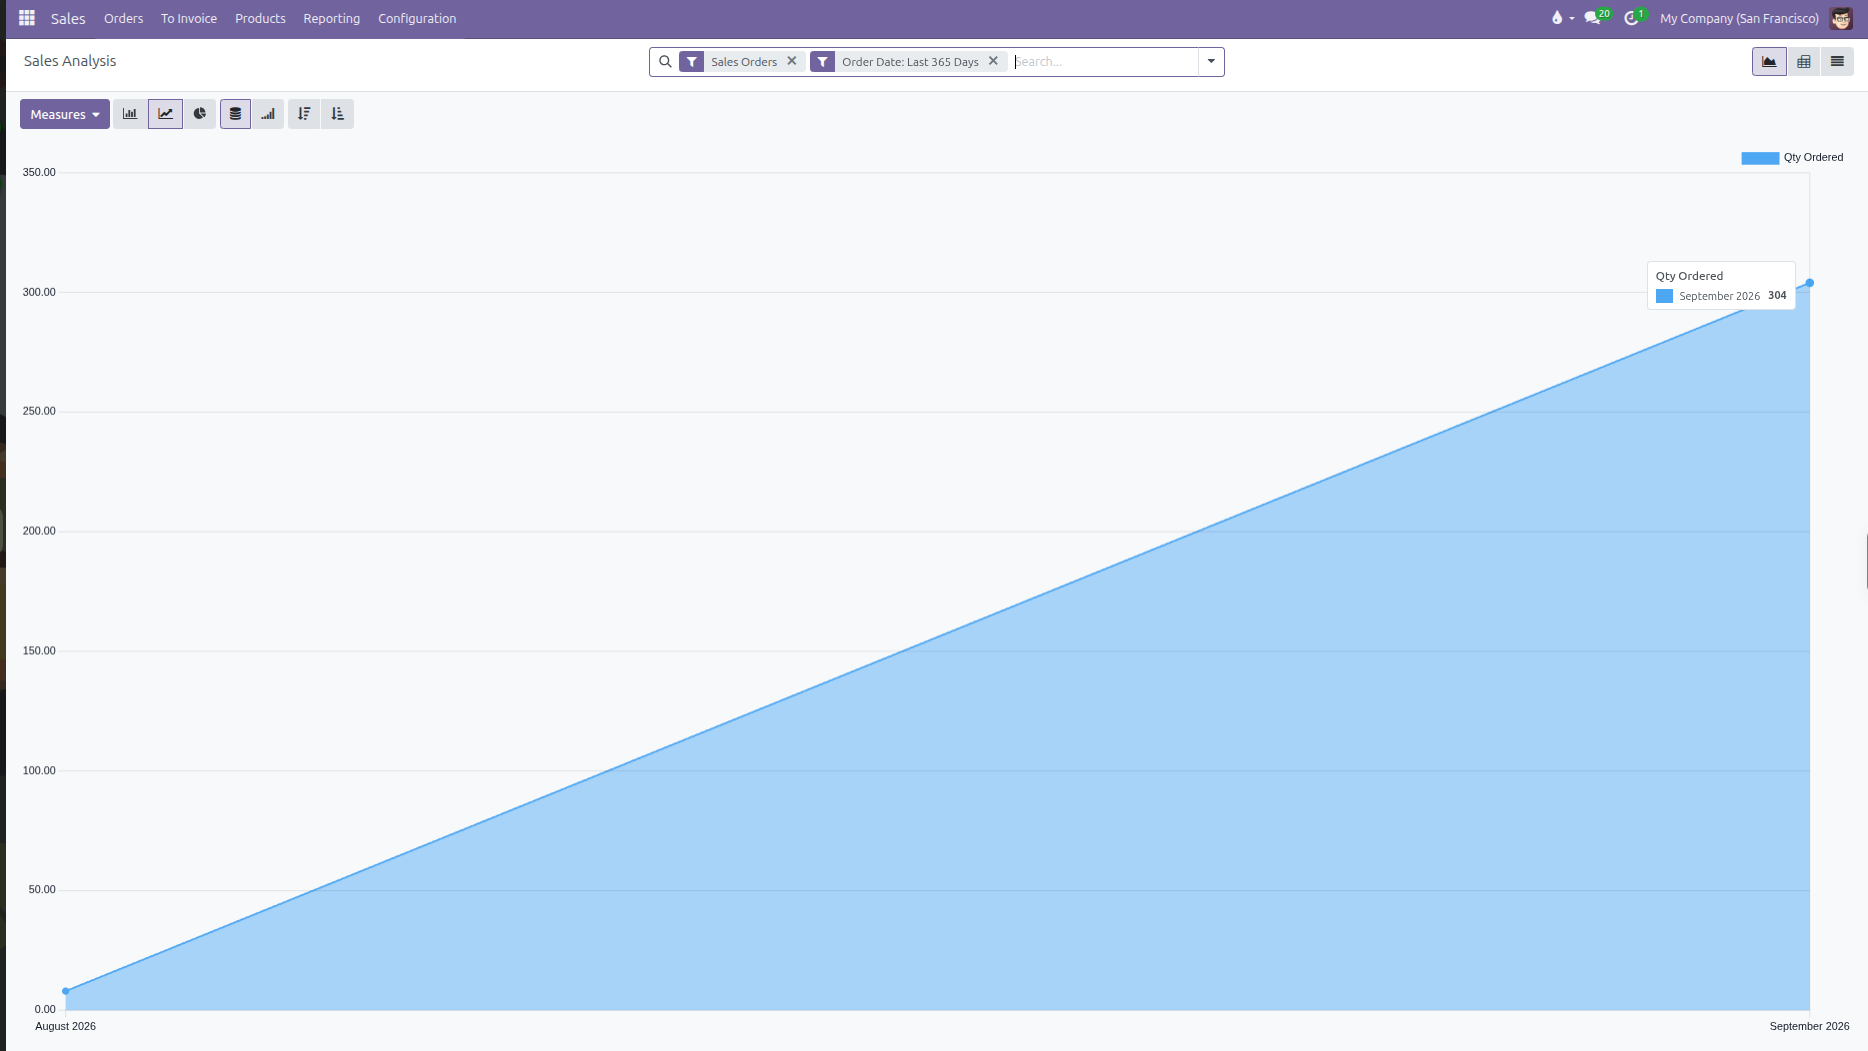
In the top navigation bar, click Reporting > Sales.
By default, CURQ opens the Sales Analysis report in a Line Chart view pre-filtered by Sales Orders and Order Date: Last 365 Days.
Hover over data points on the timeline to inspect exact monthly metrics (such as units ordered or revenue).
Click the Measures button to switch between metrics (such as Total, Untaxed Total, or Quantity Ordered).
(Optional) Use the view switcher at the top right to switch between Graph, Pivot, and List views.
3. Compare Sales Performance by Salesperson (Reporting > Salespersons)
To evaluate salesperson performance and team contributions:
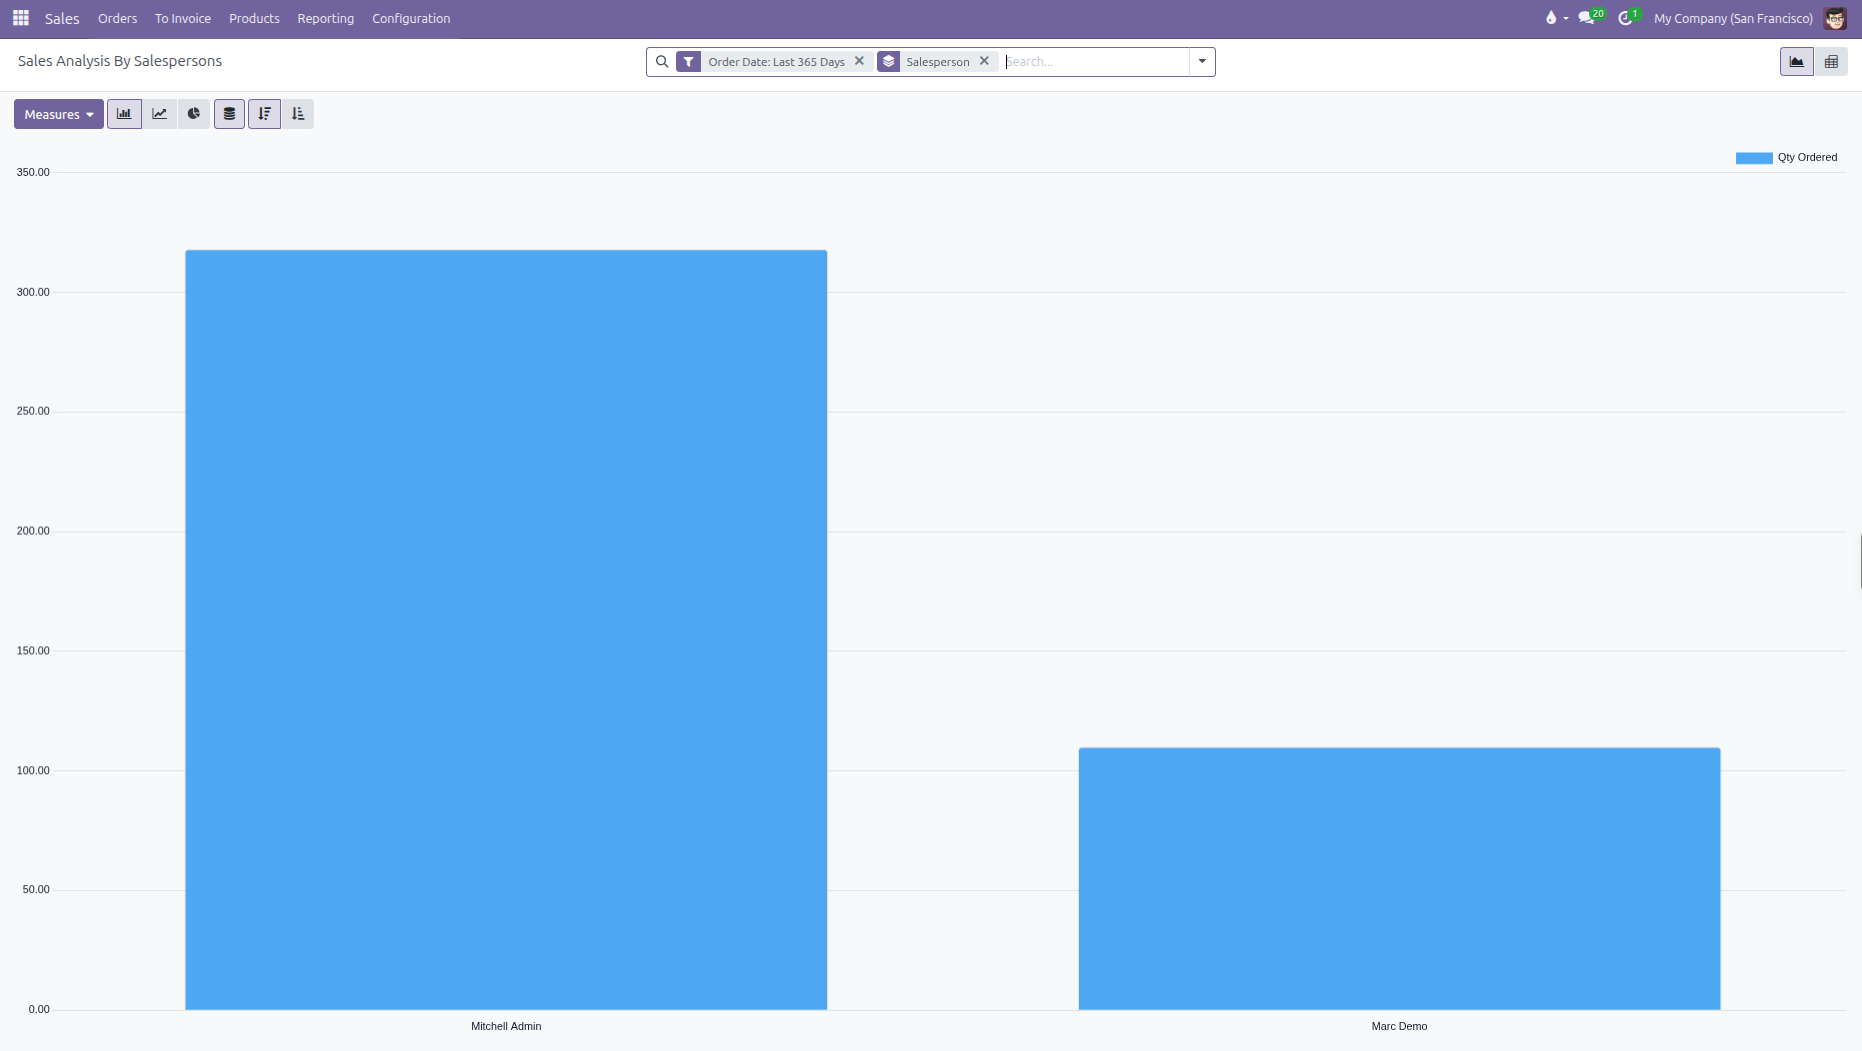
In the top navigation bar, click Reporting > Salespersons.
CURQ opens the report in a Bar Chart view pre-grouped by Salesperson and pre-filtered by Order Date: Last 365 Days.
Click the Measures button to switch between metrics (such as Untaxed Total, Total, or Quantity Ordered).
Review individual salesperson contributions in the bar chart or switch to the Pivot view to view exact values.
4. Check Which Product Sells the Most (Reporting > Products)
To find your top selling products:
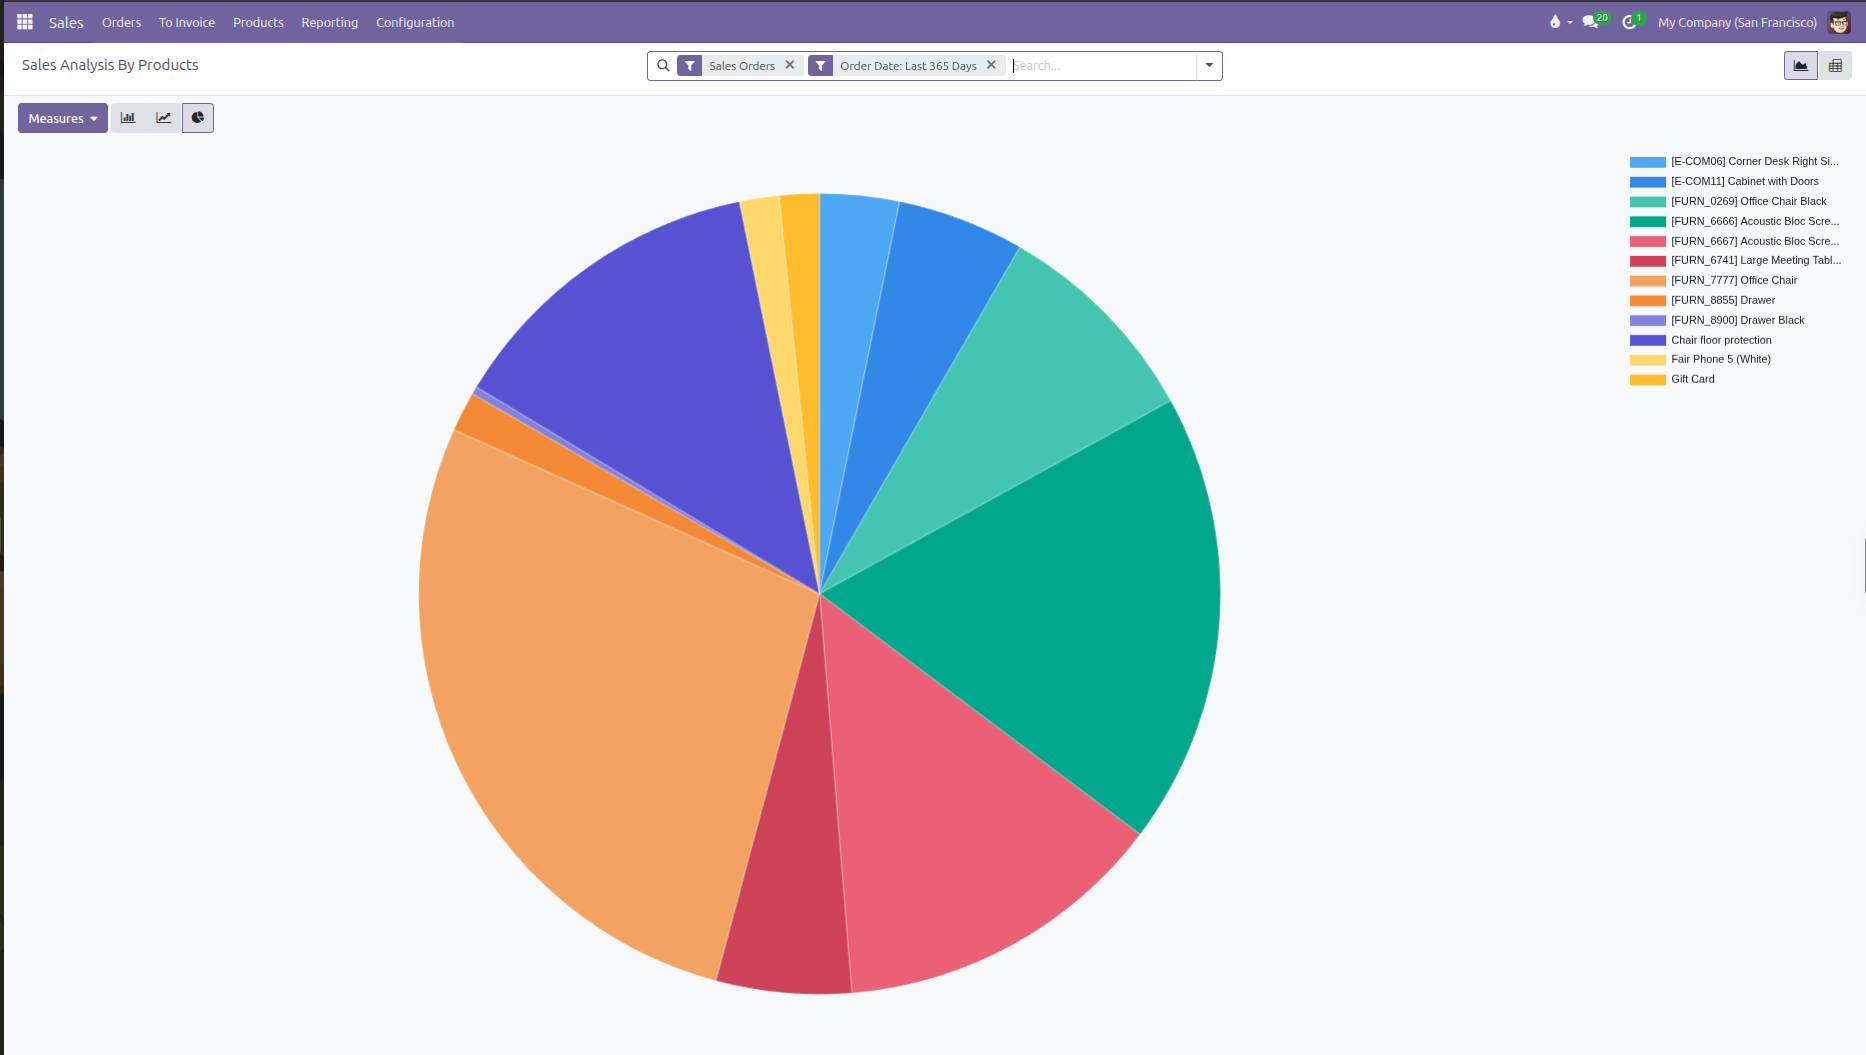
In the top navigation bar, click Reporting > Products.
By default, CURQ opens the report in a Pie Chart view pre-filtered with two search filters:
Sales Orders: Includes confirmed sales orders and excludes unconfirmed draft quotes.
Order Date: Last 365 Days: Restricts data to orders confirmed in the past rolling year. Each product appears as a colored slice with a product legend listed on the right.
Click the Measures button at the top left to choose your metric:
Select Total to rank products by sales revenue.
Select Quantity Ordered to rank products by unit volume.
(Optional) Click the Bar Chart icon at the top left and select Descending to display products side by side from highest to lowest volume.
5. Check Customers with Highest Order Quantity or Revenue (Reporting > Customers)
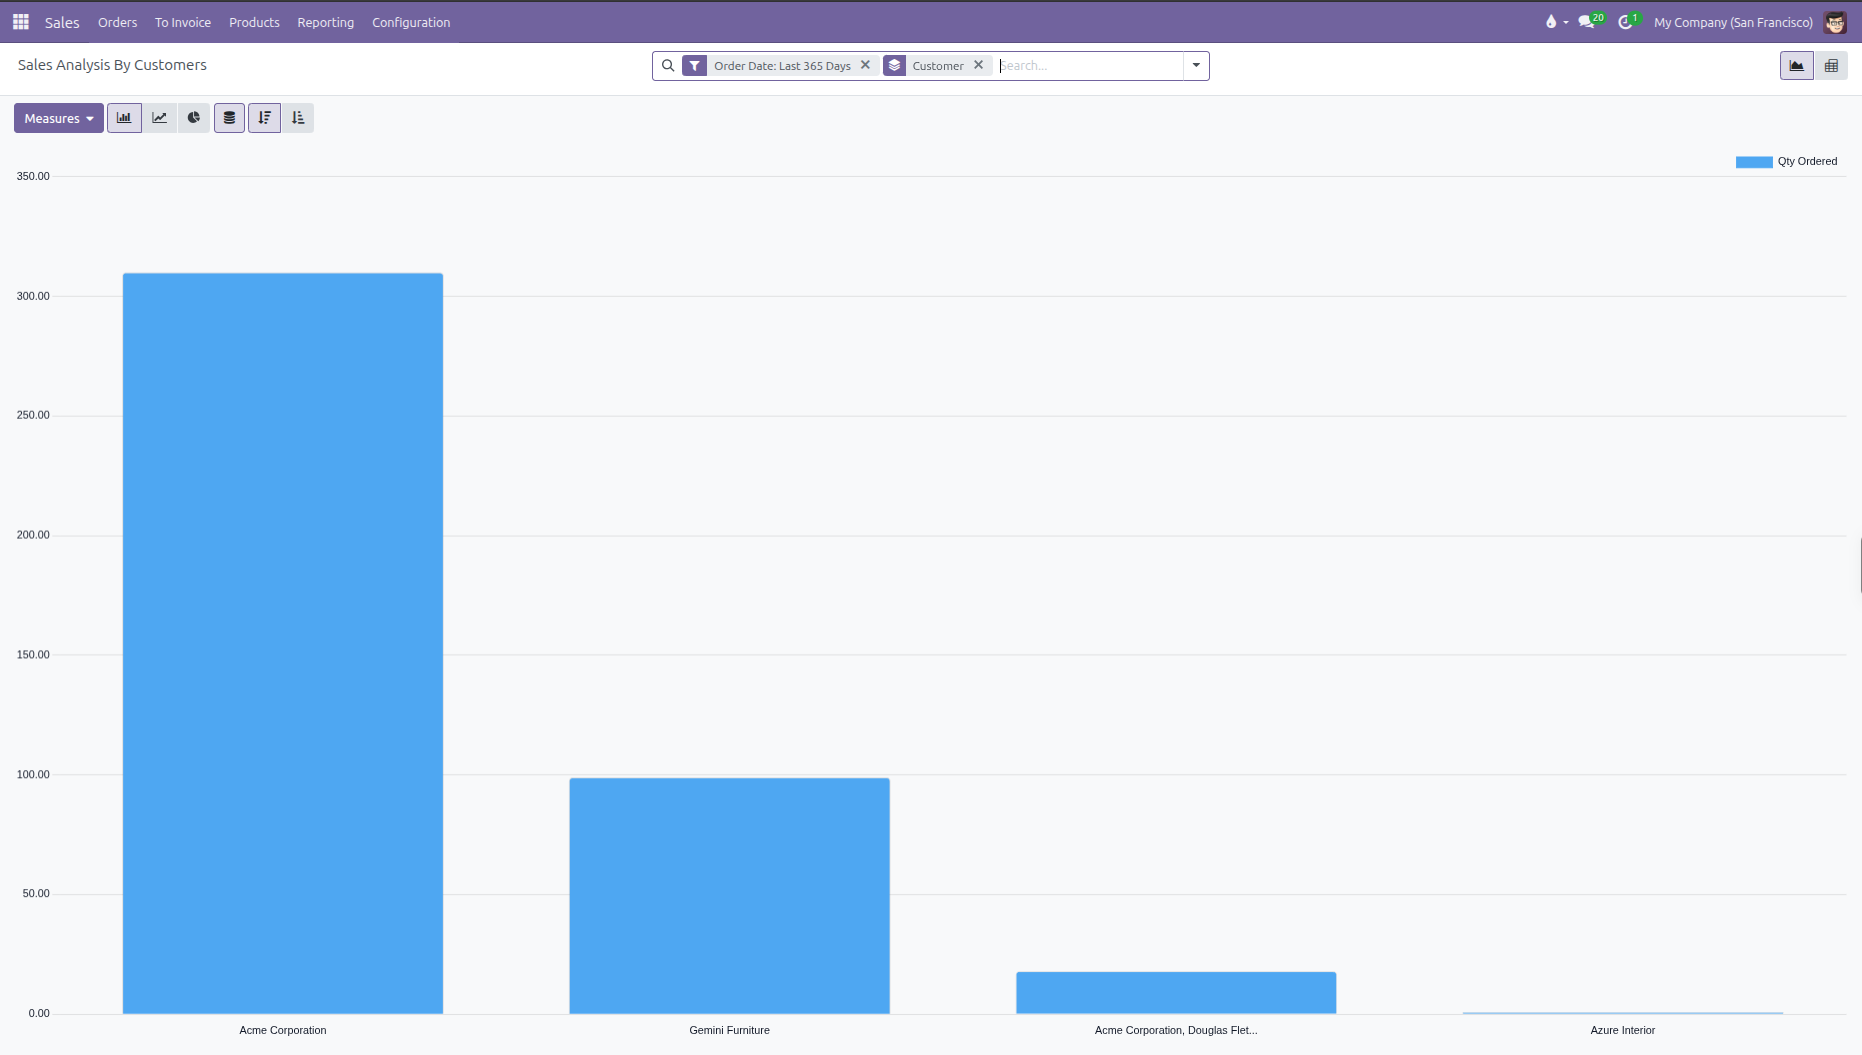
To find which customers buy the most volume:
In the top navigation bar, click Reporting > Customers.
CURQ opens the report pre-grouped by Customer and pre-filtered by Order Date: Last 365 Days.
Click the Measures button at the top left:
Select Quantity Ordered to rank accounts by total unit volume.
Select Total to rank accounts by overall revenue.
Click the Descending icon in the graph controls to display your top purchasing accounts first.